A major advantage of web-based delivery is that it doesn't have to look like "specialized engineering software." It can be fully integrated into a client's existing project site or municipal portal.
Demonstration Case Study
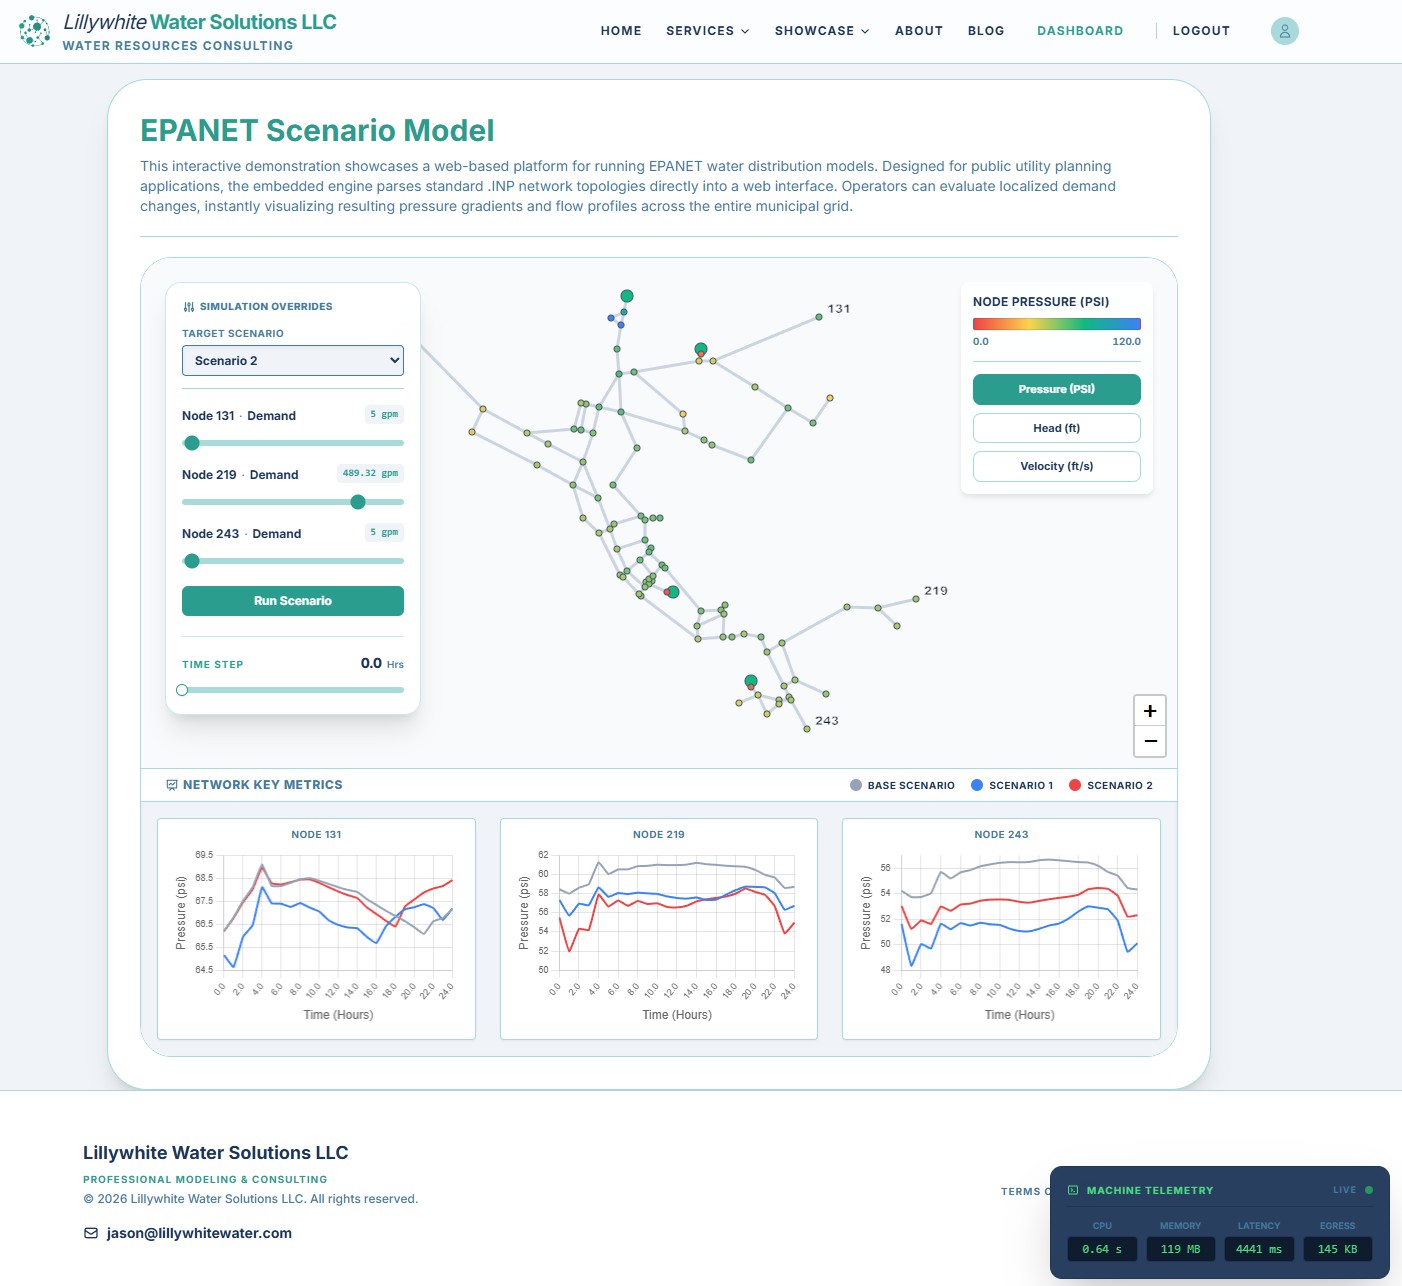
To demonstrate this, let's look at a mock-up for the City of Riverbend (a made-up place). They are currently evaluating how proposed residential growth impacts their public hydraulic infrastructure. Instead of sending them a spreadsheet or a static map, we provided a portal that matches their city's branding and houses the interactive model directly on their site.
- Scenario: The City of Riverbend is evaluating how proposed residential growth impacts our public hydraulic infrastructure. Use the interactive model below to simulate increased demand across three critical nodes and instantly visualize resulting pressure variations across the grid.
The Workflow
For the engineering professionals curious about the logic, this platform removes the friction of local file management while keeping the robustness of the standard EPANET engine. Here is how the system handles a user's request:
-
User Input: A user interacts with a "Simulation Overrides" panel to adjust variables like demand at a future subdivision.
-
Cloud Processing: The inputs are sent to a secure backend API. The system executes the EPANET simulation in the cloud, resolving non-linear hydraulic equations for the entire network in seconds.
-
Live Visualization: The results are streamed back to the browser. The map updates with dynamic heatmapping to show pressure and velocity changes across the grid.
Why This Approach Works for Public Infrastructure
By embedding the simulation logic directly into a custom dashboard, we provide a few key benefits for municipal and civil projects:
-
Interactive Mapping: We use geospatial data to draw pipe links, nodes, and tanks as interactive vectors. This allows users to click on specific assets to see their status rather than squinting at a static image.
-
Dynamic Heatmapping: Colors across the network update in real time based on the data.
-
Comparative Analysis: The dashboard allows for side-by-side comparisons of the "Base Scenario" (current infrastructure) versus proposed custom scenarios.
The model illustrated above is fully accessible in our interactive demo library. Users can log in directly from their browser to run their own infrastructure loading checks.
Curious to see what happens when you alter the commercial demand near the new development? Check out the tool in the Demo Library.