What is the Stochastic Climate Simulator?
First published: October 2026
Last updated: October 23, 2026
[!NOTE] The Stochastic Climate Simulator is designed for civil engineers, hydrologists, water resource planners, mine water managers, and GoldSim modelers who need realistic weather sequences without needing to write code or configure complex Python environments.
Welcome to the Stochastic Climate Simulator, an interactive web application and calculation platform designed to generate realistic synthetic daily and sub-daily weather data—specifically precipitation and temperature—for hydrological and environmental models.
Why Stochastic Weather Generation Matters
When designing water infrastructure, tailing storage facilities, municipal water supplies, or flood control dams, relying on a single historical weather record can create a false sense of security.
Historical records represent only one possible roll of the climatic dice. A 30-year gauge record might never have captured: - A severe multi-year drought (e.g. 3 consecutive dry years). - Two 50-year storms occurring within the same month. - An unusually warm spring causing rapid snowmelt on top of high antecedent soil moisture.
If your hydrologic model only plays back the past 30 years in chronological order, you can only test how your system would perform against that exact historical replay. You cannot answer critical risk questions: * What is the probability that our retention pond will overflow over the next 50 years? * How resilient is our water supply if next year experiences the worst drought in a 500-year synthetic realization?
The Stochastic Climate Simulator solves this problem. It analyzes your historical weather record to extract its underlying statistical "DNA" (seasonality, storm probabilities, extreme rainfall distributions, and temperature swings). It then uses that DNA to generate dozens, hundreds, or thousands of statistically authentic synthetic weather sequences.
The Three Fundamental Capabilities
The application delivers three interconnected functions:
graph TD
    A["1. Historical Ingestion & Analysis"] -->|"Sanitize & Screen"| B["2. CLIGEN Parameter Calibration"]
    B -->|"In-Browser Synthesis"| C["3A. Web Simulation & Parity Testing"]
    B -->|"Copy 2D Matrices & DLL"| D["3B. Native GoldSim Monte Carlo"]
1. Historical Ingestion & Visual Analysis
Explore historical records from thousands of global weather stations (NOAA Global Historical Climatology Network) or upload your own daily rain and temperature gauge records (CSV or Excel). Visually sanity-check monthly averages, frost/freeze cycles, diurnal temperature ranges, and data quality before running simulations.
2. Authentic USDA CLIGEN Calibration
The application fits the mathematical formulations of CLIGEN (the USDA Agricultural Research Service stochastic weather generator). Unlike naive weather tools that assume rainfall follows a standard bell curve, CLIGEN accounts for: - Markov Chain Rain Occurrence: The realistic odds of rain depending on whether yesterday was rainy or dry. - Skewed Rainfall Depth (Pearson Type III): Correctly capturing rare, heavy downpours that drive peak runoff and flood risks without distorting ordinary light showers. - Conditioned Temperature: Accounting for the fact that rainy days are naturally cooler and cloudier than sunny days.
3. Dual Execution: Web App & Native GoldSim Engine
- In-Browser Simulator: Run 1-year to 500-year daily or sub-daily simulations instantly inside your web browser. Inspect hyetographs, temperature envelopes, and multi-realization percentile bands (P10, P50, P90).
- Native GoldSim Integration (
CligenWeather.dll): Download our compiled Windows 64-bit dynamic link library. Place it directly in your GoldSim model directory, paste your site's calibrated CLIGEN parameter tables into GoldSim Data elements, and run high-speed Monte Carlo simulations directly inside GoldSim with zero Python dependencies or external data files.
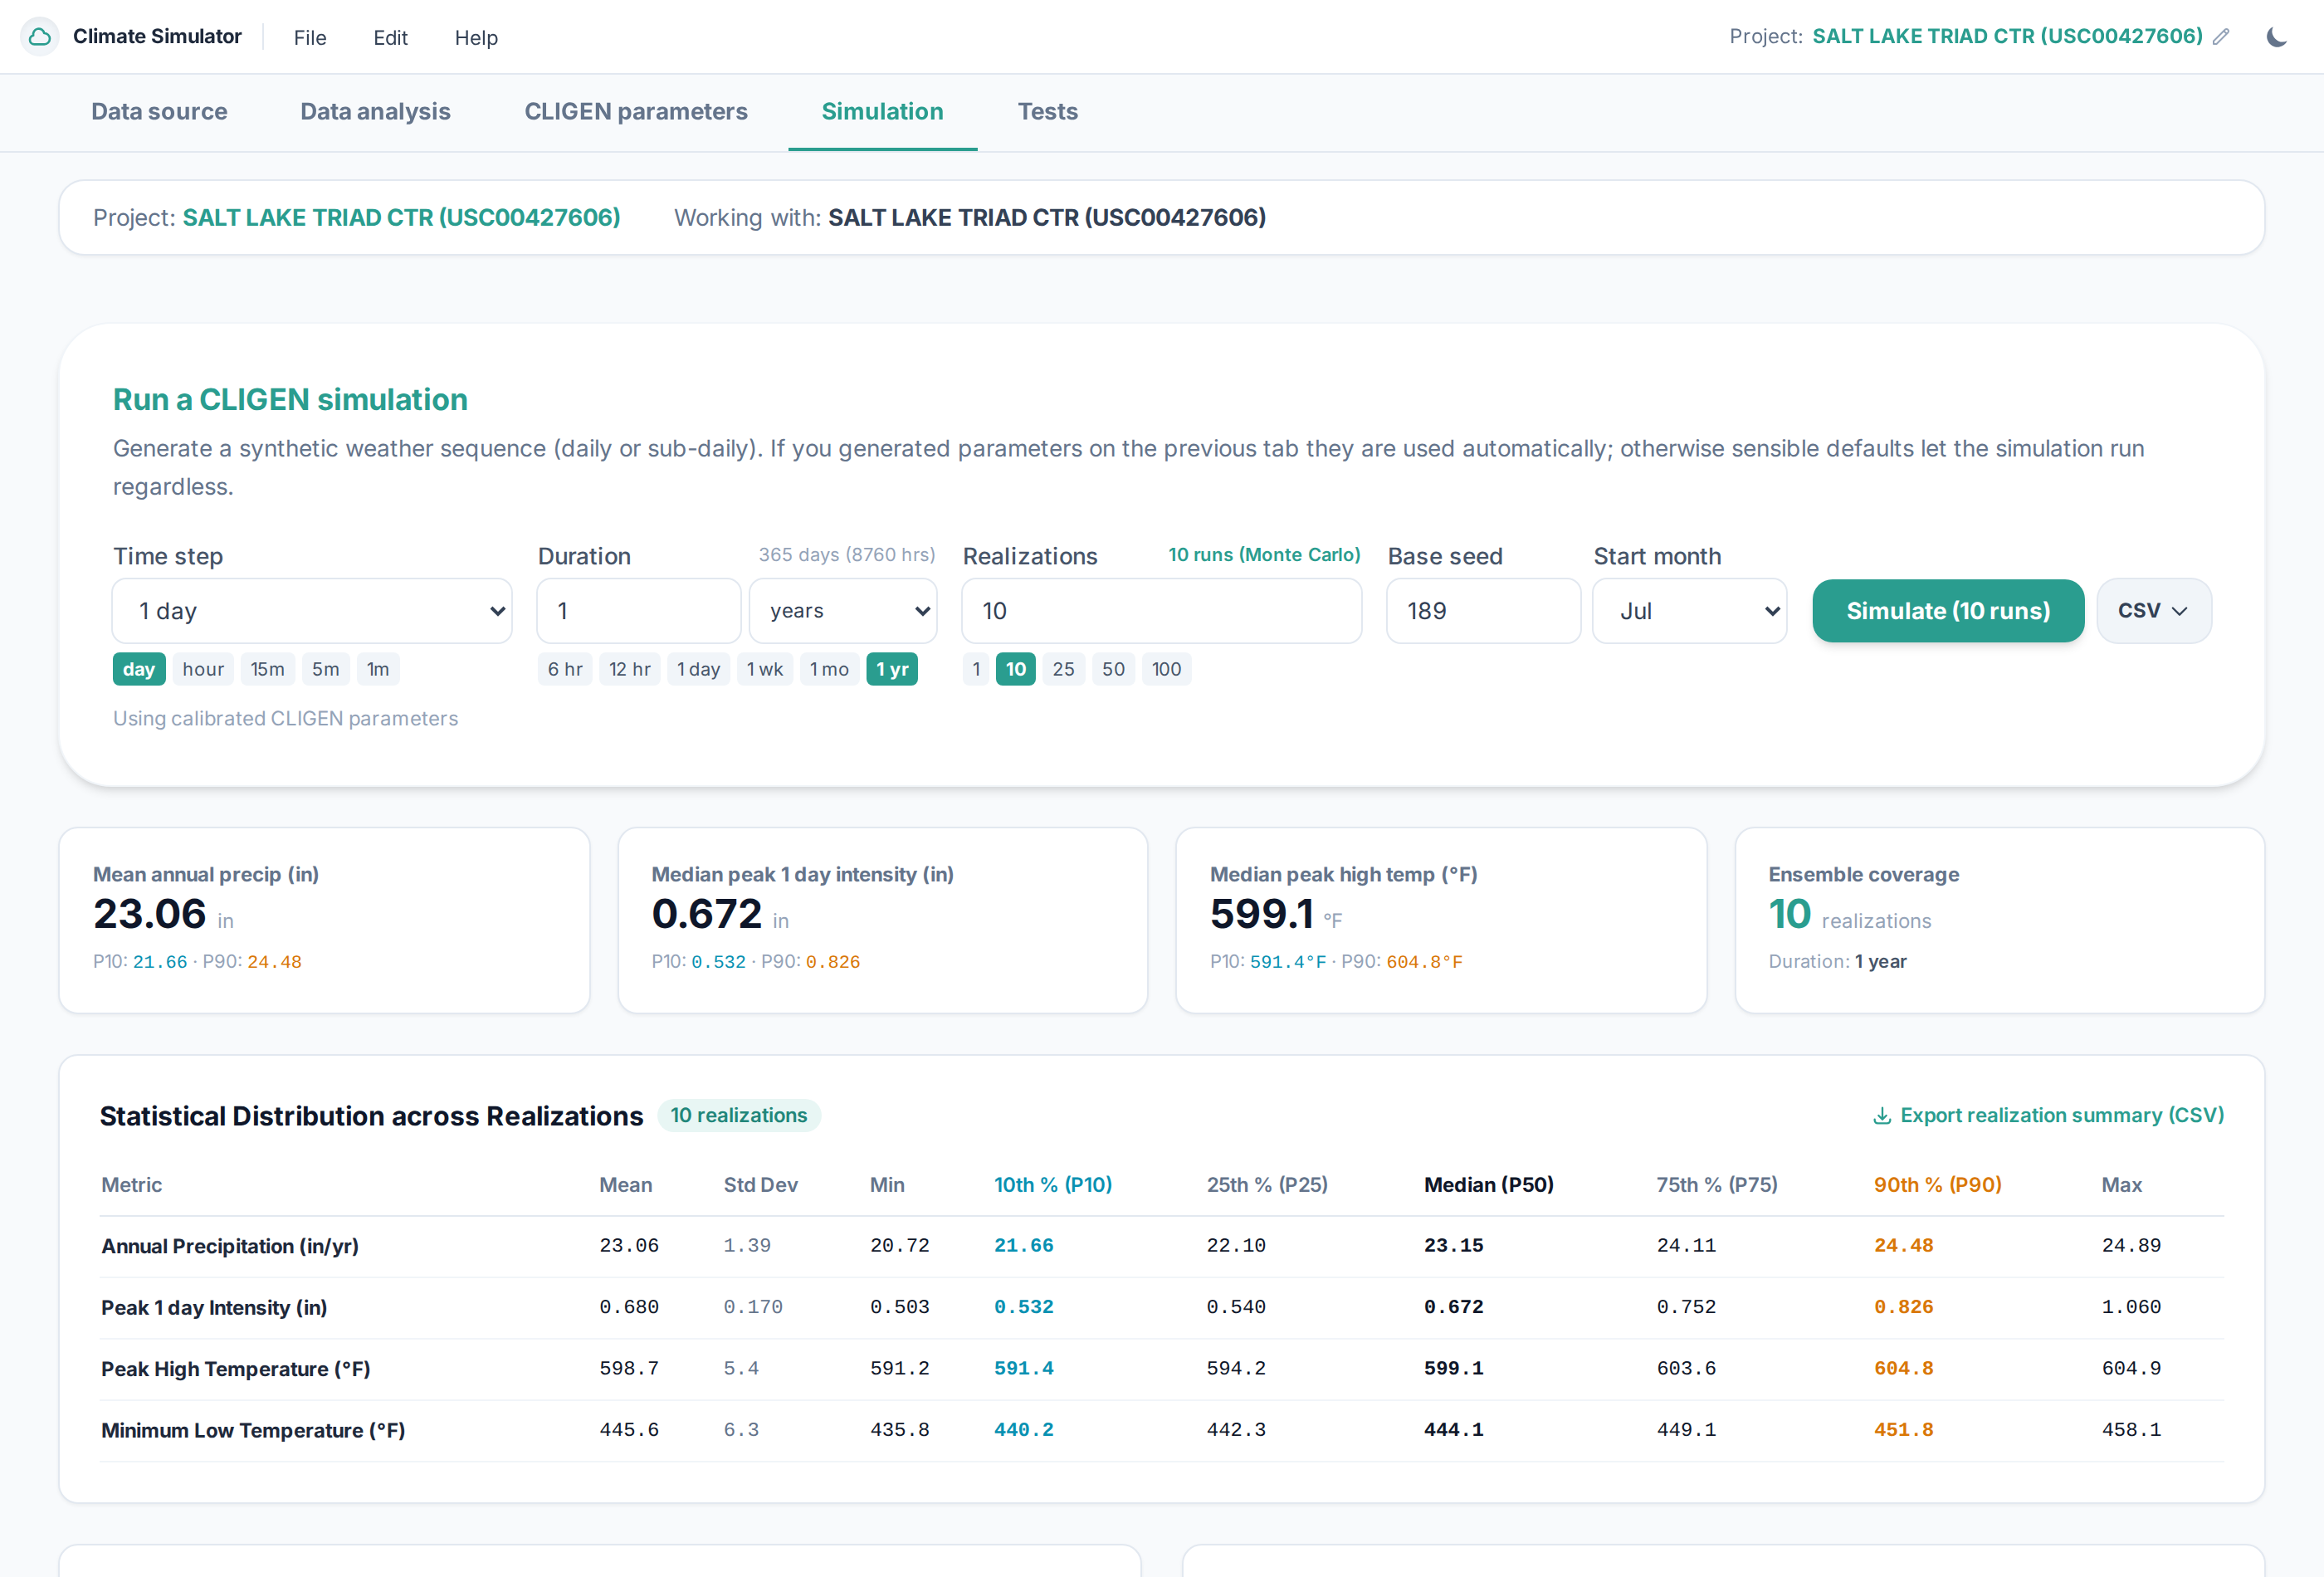 Figure: The in-browser simulation dashboard generating a 10-realization Monte Carlo ensemble, displaying statistical distributions, peak intensities, and temperature percentiles.
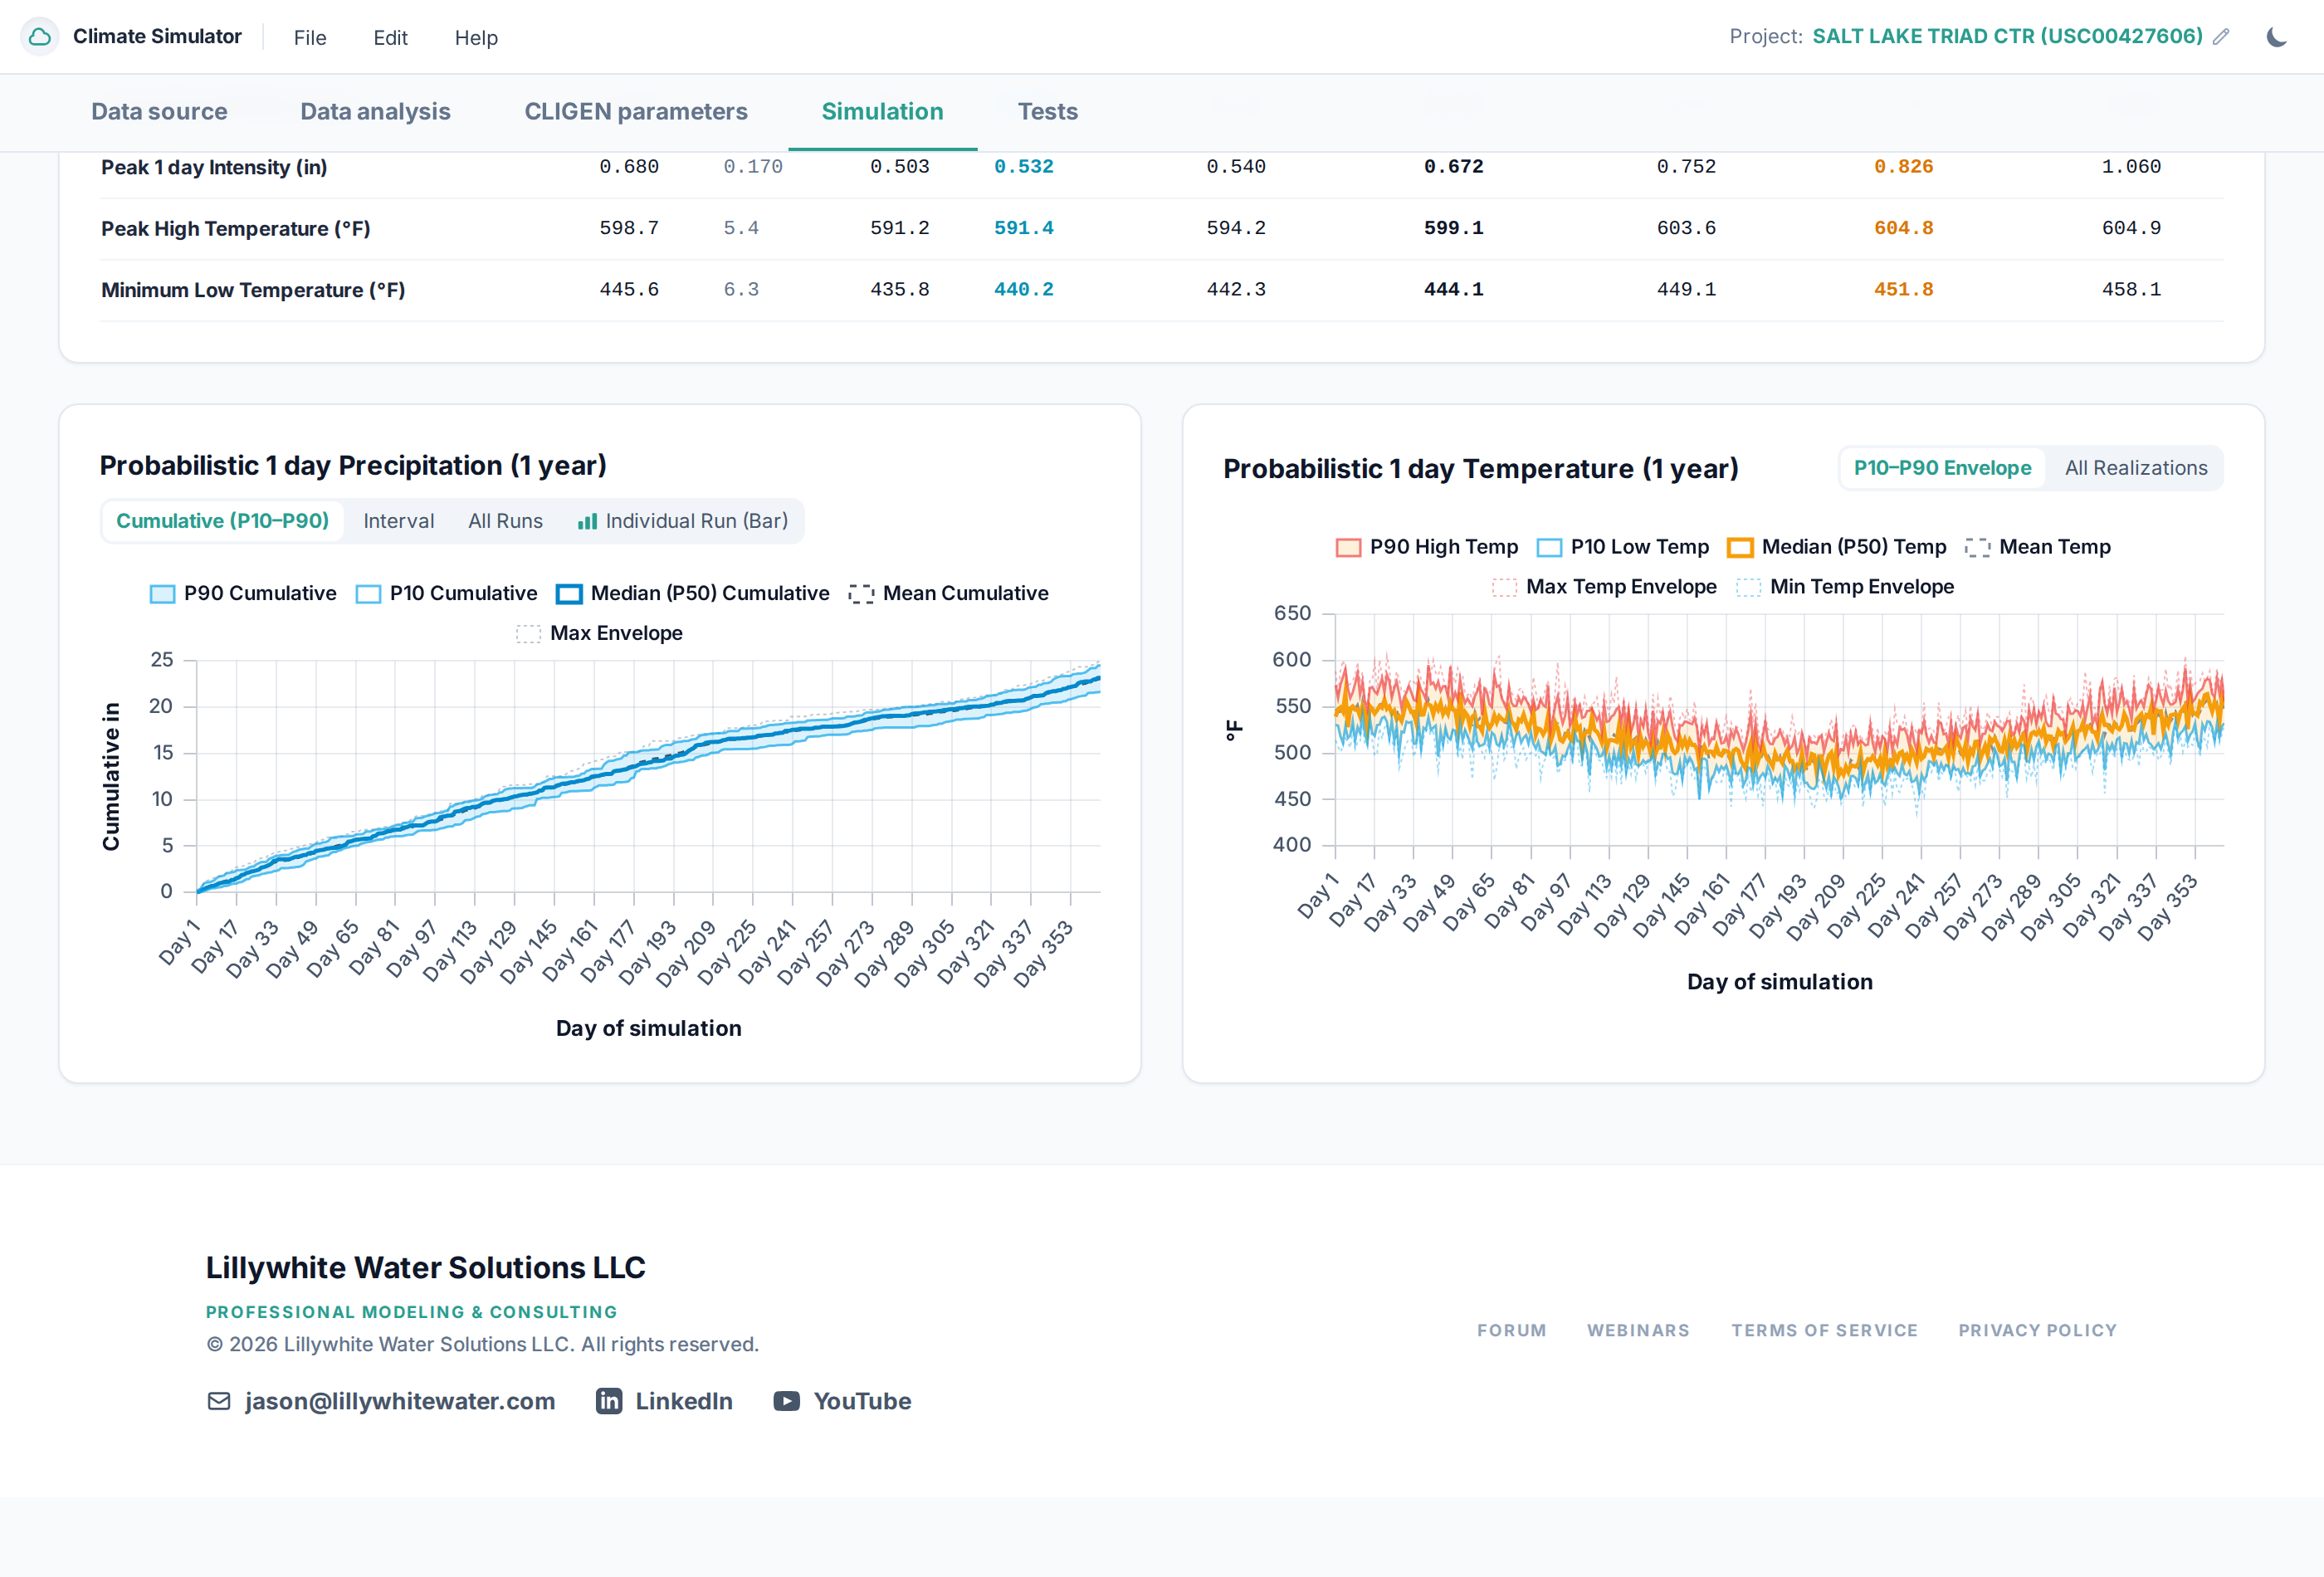 Figure: Probabilistic simulation results showing cumulative precipitation (P10, P50 median, and P90 bounds) alongside seasonal temperature envelopes.
Who is this Tool For?
- Water Resources & Civil Engineers: Sizing storage ponds, culverts, storm sewers, and spillways.
- Mine Water & Tailings Managers: Modeling water balance, heap leach facilities, and site closure water management under prolonged droughts or wet periods.
- Agricultural & Watershed Scientists: Estimating soil erosion, reservoir yields, and crop water demands.
- GoldSim Practitioners: Adding rigorous, multi-realization stochastic climate drivers to dynamic system models without the complexity of managing large external text files.