Turbine Node
The Turbine node is an active component that extracts hydraulic energy from your system and converts it into mechanical or electrical power. It essentially acts as the inverse of a pump: water flowing through the turbine experiences a drop in head (headloss), generating power in the process.
[!NOTE] Similar to Pumps and Valves, the Turbine is visually represented as a single node in the R-THYM UI for simplicity. The physics engine dynamically expands it into an upstream junction, a downstream junction, and an internal turbine link before solving the hydraulics (as detailed in Appendix A).
UI Workflow and Configuration
To add a Turbine to your model, click its icon in the Component Toolbar and drag it onto the canvas.

Because a turbine extracts energy directionally, pay attention to how you connect your pipes: water flows from the first pipe you connect, into the second pipe.
Double-click or right-click the node and select Properties to configure it.
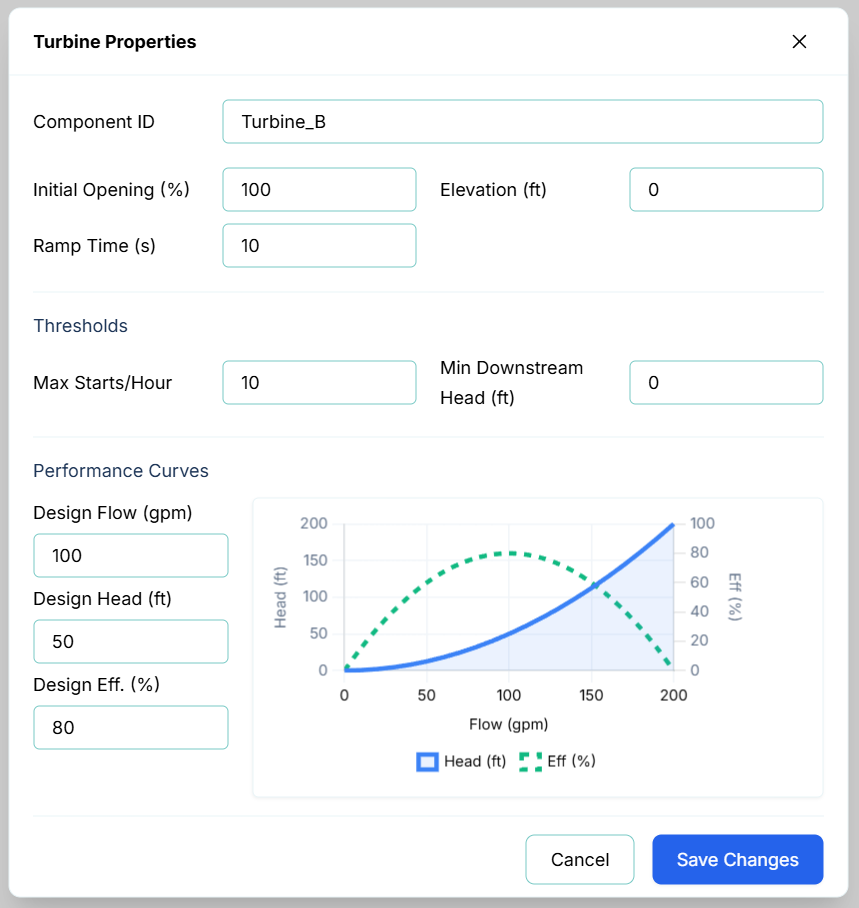
The primary configuration fields include:
- Component ID and Elevation (ft)
- Initial Opening (%): The starting operational state of the turbine (0% = OFF, 100% = Fully ON, or anywhere in between).
- Ramp Time (s): The time it takes for the turbine to spool up or down when changing speeds or turning on/off.
- Thresholds: Set limits for Max Starts/Hour and Min Downstream Head (ft) to trigger warnings in the telemetry panel if the turbine short-cycles or if the tailwater drops below safe operational limits.
Performance Curves
The bottom of the properties dialog features an interactive performance curve. By adjusting the Design Flow (gpm), Design Head (ft), and Design Eff. (%), R-THYM automatically calculates the theoretical affinity-law curve for power extraction and updates the graph on the fly. The blue line represents Head vs Flow, while the dashed green line represents Efficiency vs Flow.
Real-Time Interaction
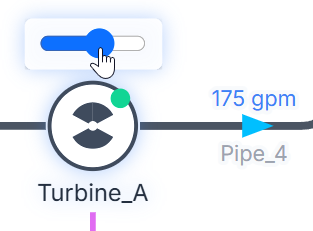
You can interact with a Turbine manually while a simulation is actively running. Clicking the small indicator dot on the top right corner of the Turbine's node icon acts as a manual toggle switch, allowing you to instantly turn the turbine ON or OFF in real-time.

Additionally, an interactive slider appears above the turbine icon during the simulation. You can use your mouse to click and drag this slider to adjust the turbine's speed/opening percentage on the fly, instantly altering the amount of head extracted and power generated!
Live Telemetry
Left-clicking a Turbine on the canvas reveals its performance data in the right-hand Telemetry Panel.
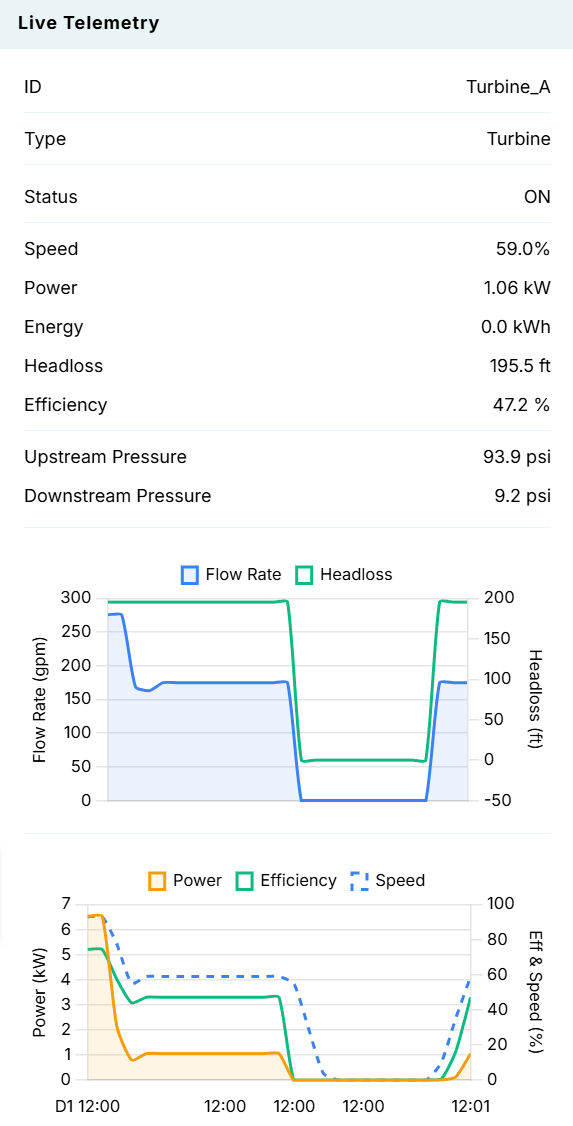
The panel is split into three sections:
- Instantaneous Metrics: Displays real-time values for Status, Speed (%), generated Power (kW), accumulated Energy (kWh), Headloss (ft), Efficiency (%), and the absolute Upstream and Downstream Pressures.
- Hydraulic Chart (Flow Rate & Headloss): Dynamically plots the flow rate (gpm) and the headloss (energy extracted) across the turbine over time.
- Electrical Chart (Power, Efficiency, Speed): Plots the generated electrical Power (kW), mechanical Efficiency (%), and operating Speed (%) as the simulation progresses.