Simulation Controls & Top Bar
While the main menus handle project setup and data management, the top bar of the application is your primary command center for running, monitoring, and controlling the hydraulic physics engine.

Here is a breakdown of the controls available across the top bar:
Project Name
On the left side of the simulation controls, you will see the name of your currently active project. This is a simple indicator to ensure you are working in the correct model workspace. When you type Ctrl-S, the name will briefly turn green indicating the project has been saved.
Core Simulation Controls
These buttons control the flow of time within your digital twin:
- Start / Pause / Resume: This button toggles the simulation engine. When active, it continuously calculates the hydraulic state (pressure, flow, energy) of the network. Click it again to pause the simulation and hold the current state.
- Reset: This button halts the engine and resets the clock and all network states (such as tank levels, battery charge, and valve positions) back to their initial starting conditions.

Clock & Duration Display
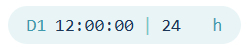
Located right next to the playback controls, this pill shows the current simulation time (e.g., D1 12:00:11) alongside the total defined simulation duration (e.g., 24 h).
- This acts as both a status display and a control input. You can click on the duration to adjust how long the simulation should run before automatically pausing.
Simulation Mode Toggle
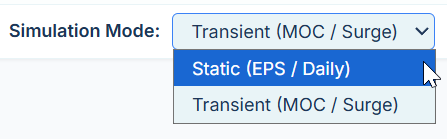
This dropdown is one of the most important controls in the platform. It allows you to switch between the two distinct physics engines built into R-THYM:
- Static (EPS): Extended Period Simulation. This mode calculates the steady-state hydraulics of the network over a long period (e.g., 24 hours), updating slowly. It is ideal for analyzing long-term tank fill/draw cycles, energy costs, and daily water deliveries.
- Transient (MOC / Surge): Method of Characteristics. This mode engages a high-frequency, millisecond-resolution solver to calculate rapid pressure waves and water hammer events caused by sudden valve closures or pump trips.
Speed Slider & Rate Display
When running a 24-hour EPS simulation, you likely don't want to wait 24 hours in real life!
- Speed Slider: Allows you to adjust the calculation speed of the engine, ranging from real-time (1 second of simulation time = 1 second of real time) to extreme fast-forward.
- Rate Display: The blue pill to the right of the slider shows the actual simulation speed rate being achieved by your browser's processor (e.g.,
5.1 sec/s).
[!NOTE] When running in Transient (MOC) mode, the engine must calculate at an extremely high resolution (often 10 millisecond increments) to accurately model sonic pressure waves. Because of this heavy computational load, the speed slider's impact is reduced as the engine prioritizes mathematical accuracy over raw speed.
Scenario Manager
You can compare scenarios by adding a new scenario using the scenario manager in the top toolbar. Scenarios enable you to compare the baseline run along with any manual events you create during the run to scenarios in which we want to compare runs that use different parameters. The manual events you create during the baseline run are recorded and stored so the same events can be emitted in subsequent scenario runs and thus comparing the same sequence of events.

Select the active scenario by clicking on the name in the drop list.
You can add new scenarios by clicking on the gear button adjacent the list of scenario names. In the manager dialog, you can add up to 3 scenarios.
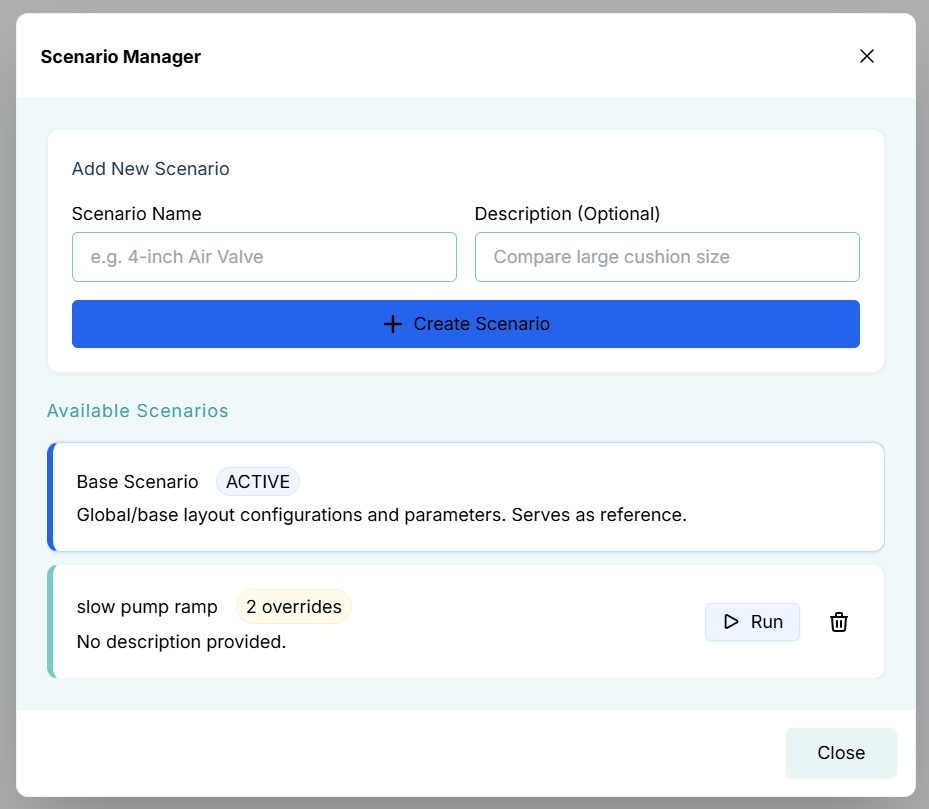
Once your scenario(s) are created, you can edit properties of any model component and that data becomes associated with the active scenario.
Software Version & Fullscreen Toggle
On the far right side of the bar:
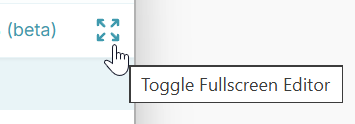
- Version: Displays the current version of the software you are running (e.g.,
R-THYM v.0.518 (beta)). - Fullscreen (Expand Icon): Clicking this icon hides the main website navigation header. This expands your digital twin canvas and analytics charts to use maximum screen real estate, which is highly recommended when working on laptop monitors!